
During a project, I needed to retrieve statistical data from a remote server and display it in a dashboard in my Grafana.
Instead of storing system information, such as CPU or network usage, I need to store and display SQL query results in a PostgreSQL database. That's why this tutorial shows how to make SQL queries.
If not, the installation procedure can be found in the Grafana documentation
Installation de InfluxDB
Data storage will be managed by an InfluxDB server, installed on the same server as Grafana. If a server is dedicated to this instance, you will simply need to adapt the data source in Grafana.
Retrieve the key to add InfluxDB repos
wget -q https://repos.influxdata.com/influxdata-archive_compat.key
echo '393e8779c89ac8d958f81f942f9ad7fb82a25e133faddaf92e15b16e6ac9ce4c influxdata-archive_compat.key' | sha256sum -c && cat influxdata-archive_compat.key | gpg --dearmor | sudo tee /etc/apt/trusted.gpg.d/influxdata-archive_compat.gpg > /dev/null
echo 'deb [signed-by=/etc/apt/trusted.gpg.d/influxdata-archive_compat.gpg] https://repos.influxdata.com/debian stable main' | sudo tee /etc/apt/sources.list.d/influxdata.list
Update the repos cache and start the installation
sudo apt-get update && sudo apt-get install influxdbStart the InfluxDB service
sudo service influxdb startDatabase Configuration
Now that the service is installed, all that remains is to configure it
Connect to InfluxDB Command Line
influxCreate the database that will host the data
CREATE DATABASE telegrafAnd that's it
Enable HTTPS and authentication on InfluxDB
If the server is publicly accessible, it is best to secure it by communicating via HTTPS.
If you don't have one, you can use a Let's Encrypt certificate
sudo apt install certbot
sudo certbot certonly --standalone -d monserver.test.localsudo mkdir /etc/influxdb/ssl
sudo cp /etc/letsencrypt/live/monserver.test.local/cert.pem /etc/influxdb/ssl/
sudo cp /etc/letsencrypt/live/monserver.test.local/privkey.pem /etc/influxdb/ssl/
sudo chown influxdb:influxdb /etc/influxdb/ssl/cert.pem /etc/influxdb/ssl/privkey.pemthen edit the file /etc/influxdb/influxdb.conf, and uncomment and modify the lines below accordingly
  enabled = true
  bind-address = ":8086"
  auth-enabled = false
  https-enabled = true
  https-certificate = "/chemin/au/certificat/influxdb.crt"
  https-private-key = "/chemin/au/certificat/influxdb.key"
restart the service to take over certificates
sudo systemctl restart influxdbConnect to the influx command line
influx -sslCreate an administrator account
CREATE USER admin WITH PASSWORD 'superMotDePasse' WITH ALL PRIVILEGESCreate an account for sending data from Telegraf
CREATE USER userTelegraf WITH PASSWORD 'autrePassword'
GRANT WRITE ON telegraf TO userTelegraf
Create another account for Grafana
CREATE USER grafana WITH PASSWORD 'your_grafana_password'
GRANT READ ON telegraf TO grafana
Disconnect from the database and modify the line below in the configuration file /etc/influxdb/influxdb.conf:
auth-enabled = false
en
auth-enabled = true
Then restart the service
sudo systemctl restart influxdbInstallation of the Telegraf
Now that the InfluxDB part is configured, it is now time to configure the remote server side.
Install the Telegraf package
curl -s https://repos.influxdata.com/influxdata-archive_compat.key > influxdata-archive_compat.key
echo '393e8779c89ac8d958f81f942f9ad7fb82a25e133faddaf92e15b16e6ac9ce4c influxdata-archive_compat.key' | sha256sum -c && cat influxdata-archive_compat.key | gpg --dearmor | sudo tee /etc/apt/trusted.gpg.d/influxdata-archive_compat.gpg > /dev/null
echo 'deb [signed-by=/etc/apt/trusted.gpg.d/influxdata-archive_compat.gpg] https://repos.influxdata.com/debian stable main' | sudo tee /etc/apt/sources.list.d/influxdata.list
sudo apt-get update && sudo apt-get install telegraf
Edit the file /etc/telegraf/telegraf.conf, and add (or uncomment) the lines below:
[[outputs.influxdb]]
  urls = ["https://serveurtest.test.local:8086"]
  database = "telegraf"
  retention_policy = ""
  write_consistency = "any"
  timeout = "5s"
  username = "telegraf"
  password = "monSuperPassword"
insecure_skip_verify = trueAdd the code block below to connect to the PostgreSQL database, and execute the desired queries
[[inputs.postgresql_extensible]]
  address = "host=localhost user=postgres dbname=database1"
  [[inputs.postgresql_extensible.query]]
    script="/etc/telegraf/db_stats.sql"
Create the SQL file that will contain the SQL queries
sudo nano /etc/telegraf/db_stats.sqlFinally, restart the Telegraf service
sudo systemctl restart telegraf.serviceConfigure the data source in Grafana
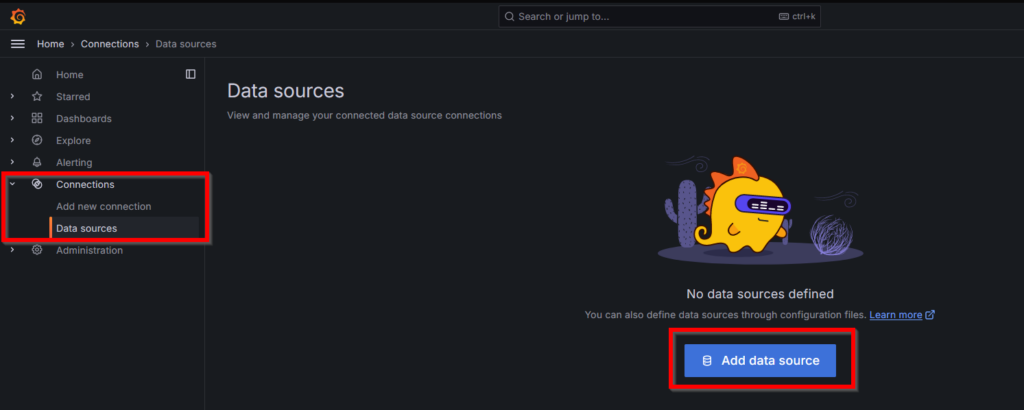
Connect to Grafana and add a new data source
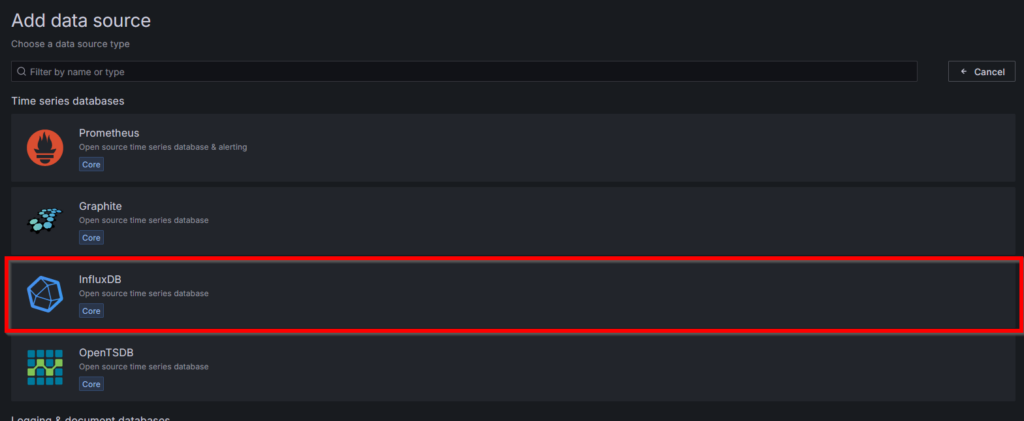
Choose "InfluxDB"
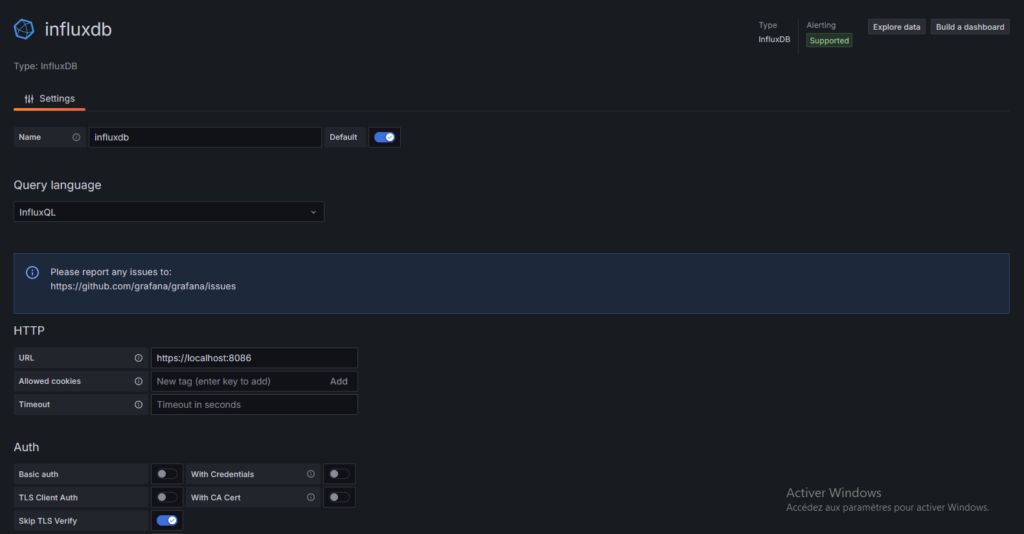
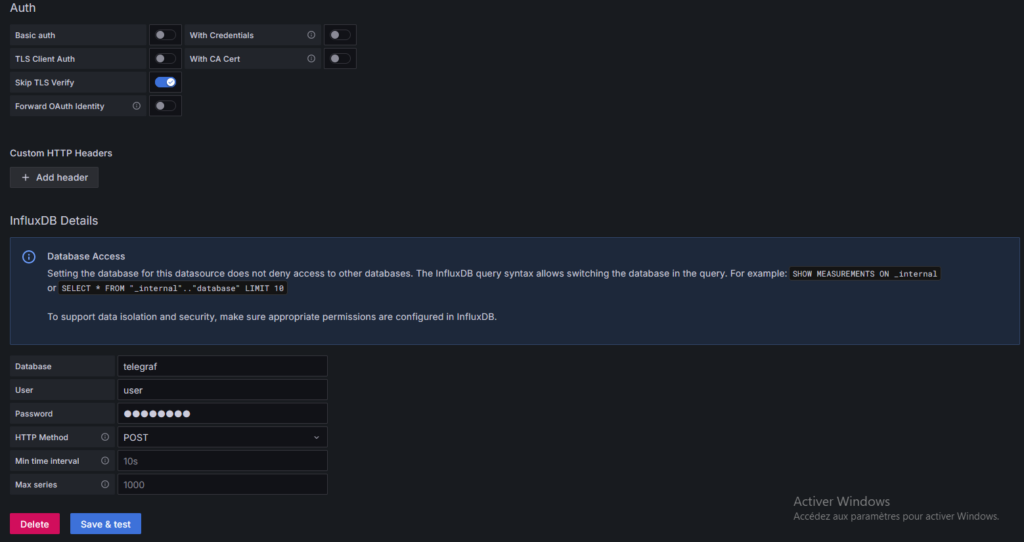
Enter the information to connect to the database
If the connection is working, the message below is displayed

All that remains is to add the collected data to a dashboard